
2025 CSU-TAPS Research Snapshot
Hosting more than a competition, the CSU-TAPS program, gathers and analyzes data from research plots to benefit producers and support ag tech partnerships.
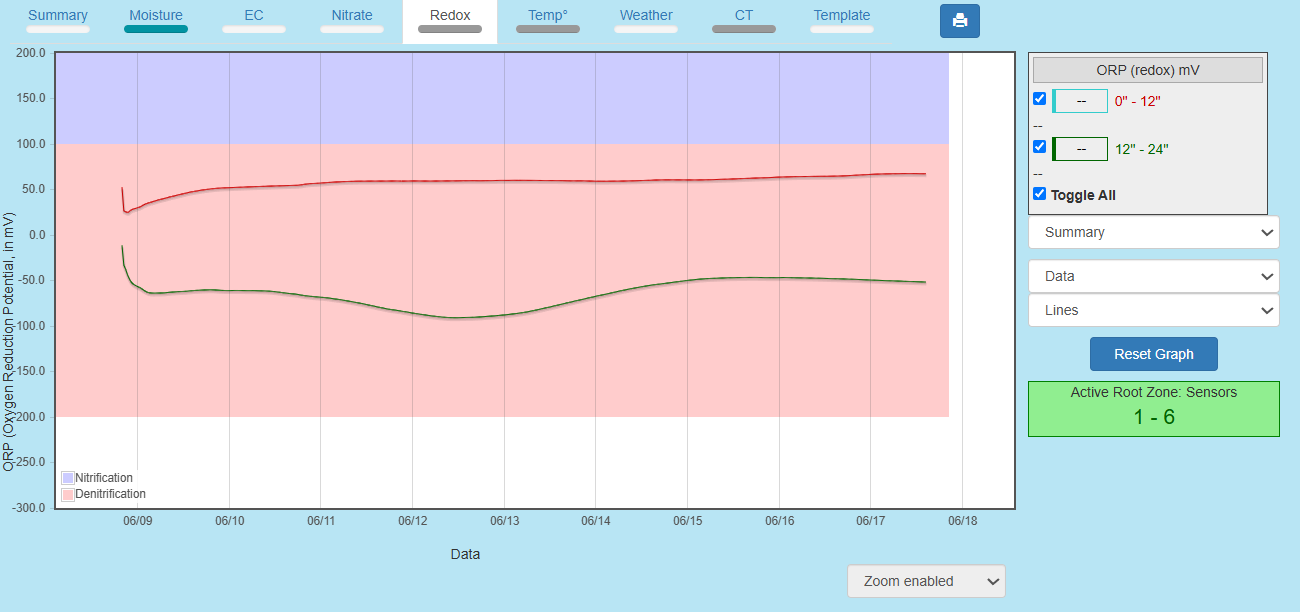
This is an early glimpse at data produced by AquaSpy’s in-ground nitrate sensor currently in pilot testing at a variety of locations in 2025, including at CSU-TAPS and UNL-TAPS. (Capture by Wub Yilma)
One of Testing Ag Performance Solutions (TAPS)’ big benefits is the data it produces! Having 25 competition “farms” operating on one field, each making six management decisions (hybrid, seeding rate, irrigation, nitrogen, crop insurance and marketing) produces a lot of data relevant for decision making. When analyzed, it can offer clarity on strategies to improve input use efficiency while maintaining production and profitability.
In addition to its competition plots, CSU-TAPS dedicates field area to research, with some aspects replicated or similarly configured at sites connected to TAPS competitions in other High Plains states. That multi-state TAPS collaboration adds power to what we can learn through data analysis.
Here’s a look at five research projects happening in 2025 in the CSU-TAPS field at Colorado State University’s Agricultural Research, Development, and Education Center (ARDEC) in Fort Collins, Colorado—summarized by CSU-TAPS Precision Irrigation Manager Wub Yilma.
1. Designing “Decision-Making” Research
TAPS field variability offers all kinds of research opportunities, but that variability also requires a keen attention to research design.
“For example, in traditional research, the researcher will set the variables in nitrogen applied and irrigation amounts; replicate it three times; collect the data; and analyze it,” Yilma explained.
However, a TAPS field is a competition first, with competitors making a variety of decisions that researchers would traditionally control.
“Each participant comes up with their decision-making strategy independently,” Yilma said. “This setup creates a unique challenge when analyzing the data, particularly when trying to assess the effects of nitrogen and irrigation treatments on yield or efficiency.”
Therefore, for the TAPS setting, “we are forming a decision-making research methodology,” Yilma said. The TAPS researchers must find innovative analytical approaches that take into account the variability of farmer decisions, in order to “gain actionable insights” from the data.
2. Fertigation Recommendations – Sentinel
Partnering with Sentinel Ag of Ithaca, Nebraska, CSU-TAPS is testing N-Time, Sentinel’s satellite imagery-based nitrogen decision support software. The software utilizes satellite imagery-based Vegetation Indices (VIs) to estimate crop nitrogen status and then provide a near real-time prescription for nitrogen application.
“We’re working with Sentinel, in part, to explore incorporating this tool into the CSU-TAPS competition as another ag tech option,” Yilma said, “where participants could receive nitrogen side dressing and fertigation recommendation.”
The CSU-TAPS team is generating weekly UAV (drone)-based multispectral imagery to be used as N-Time data inputs by Sentinel Fertigation. The data come from two image-based vegetation indices—Normalized Difference Red Edge (NDRE) and Normalized Difference Vegetation Index (NDVI)—that pull from different wavelengths of light.
NDVI builds images from visible red light and near-infrared light wavelengths, which capture overall greenness, assessing vegetation cover and growth.
NDRE uses near-infrared and “red-edge” light wavelengths to assess the amount of leaf chlorophyll in the plant cover, effective for detecting plant stress and potential nitrogen needs.
“The Sentinel nitrogen prescription will be implemented in the field using the Agri-Inject fertigation system and Zimmatic variable rate irrigation system that we have at ARDEC-South,” Yilma said.
“Sentinel will have three plots, like the participant teams, to manage as their own,” he continued. “They will provide nitrogen recommendations [through N-Time] for side-dressing at V6, and fertigation at V12, R1, and R2 corn growth stages.
“The hypothesis we’re testing is that integrating VI-based nitrogen recommendations through the growing season could improve [a farm’s] nitrogen use efficiency while maintaining yield.”
3. Continuous Nitrate Sensing – AquaSpy
CSU-TAPS and University of Nebraska-Lincoln-TAPS are both participating in AquaSpy’s pilot test of its new, in-ground nitrate sensor, Crophecy LS with AquaStrip-N. The technology offers real-time nitrate (NO3) levels in parts per million, and Oxygen Reduction Potential (ORP) in millivolts, with continuous monitoring.
“It’s a new sensor and it’s exciting to be part of this test across multiple corn hybrids under grower nitrogen and water decision making,” Yilma said. CSU-TAPS and UNL-TAPS are part of the San Diego, California-based company’s beta-testing of more than 400 pilots.
“The sensors provide a continuous nitrate reading at six depth intervals, spaced every 4 inches, from 0 to 24 inches” he added. “So, ideally, from the day we install it until we harvest, we have a clearer understanding of how much nitrate is present in the soil over time and across depth.”
As part of the beta testing pilot, CSU-TAPS has installed 13 of the nitrogen sensors, and UNL-TAPS an additional 12.
One objective is to monitor nitrate usage by the plants, and at the same time investigate how the varying plant population, nitrogen fertilizer rates, and irrigation amounts influence the soil nitrate concentration over time and depth. To do that, CSU-TAPS installed these sensors in plots with different seeding rates ranging from 20,000 to 35,000 seeds/acre, and in plots being managed in CSU-TAPS’ full and limited irrigation tracks.
Based on early season soil testing, nitrogen variability present within the CSU-TAPS field offers a great testing ground for the nitrate sensors, and a great opportunity to gain understanding regarding how soil nitrogen and irrigation applications interact. The team has collected and will continue to collect soil and plant tissue samples, remote sensing, yield, and yield component data for a comprehensive scientific analysis.
“We are aspiring to have a time series analysis from the measured nitrate concentration,” Yilma said, “including detecting the patterns and sensitivity concerning nitrogen and irrigation application throughout the growing season.
“Part of what makes working with these sensors unique for us this year is the involvement of the [CSU Agronomy Club team] students, participating in the competition for the first time,” he added. “We wanted this to be a learning experience for them, so a nitrate sensor was also designated for the student-managed plot. They’ll have access to the nitrate and ORP readings to observe and monitor how the nitrate changes over time and depth.”
4. Limited Irrigation & Seeding Rate – CSU Colorado Water Center
In collaboration with Joel Schneekloth, CSU regional water resources specialist, CSU-TAPS is testing the interaction of a limited irrigation strategy with population density.
“Our objective is to evaluate the yield response and water use efficiency for different plant populations under 50% of the limited irrigation allotment,” Yilma explained. “The goal is to identify the optimum populations under limited irrigation practices.
“For 2025, limited irrigation track participants are allowed 12 inches of water (for the season), so these resarch plots will receive 6 inches,” he noted.
The research design involves a field experiment with three replicates of population density for 20,000, 25,000, and 30,000 plants per acre. Additionally, similar data from competitor-managed limited irrigation track plots will be incorporated, as needed, to enhance the overall quality of the dataset.
“We’re using Arable Mark 3 devices to measure crop evapotranspiration in these plots and NDVI data for each treatment,” Yilma said. “This will support our estimation of water use efficiency under various population densities in the limited irrigation competition track.”
5. Yield Prediction Model Building
“In TAPS, we collect and process an extensive amount of data from our sprinkler corn farm competition,” Yilma said, in addition to what is collected from the research plots.
TAPS collects data on soil physical and chemical properties; plant tissue sample analysis; drone imagery-based VIs; direct field observations; soil moisture sensing; crop yields; and participant management decisions such as amounts of nitrogen and irrigation applied, as well as insurance and marketing decisions.
“We can use all this data to recognize patterns between the variables to predict yield using machine learning algorithms,” Yilma said, “to build yield prediction models.”
Prediction models use historical data to calculate or predict future outcomes. In this case, the magnitude of data available from the CSU-TAPS field alone can be mined statistically to create models that can help farmers make management decisions for specific outcomes, such as yield or profitability. Combining data from CSU-TAPS and other TAPS competitions could exponentially increase the statistical power and effectiveness of these predictive models.
“Currently, we are processing 2023 and 2024 CSU-TAPS data through machine learning algorithms—such as Partial Least Squares Regression (PLSR), Random Forest (RF), and Support Vector Regression (SVR),” Yilma said. At the end of this season, the 2025 competition data will be added to the growing CSU-TAPS competition dataset.
Data analysis can help the team disregard parameters that don’t have a high predictive influence for certain goals, and they might find high correlations between specific parameters.
“We are asking each algorithm to perform yield prediction and identify the parameters most sensitive to yield variability,” Yilma said. “We will compare each model’s performance to determine which algorithm offers the most accurate yield estimates.”
Yilma pointed out that while working on yield prediction modeling is not new, applying TAPS data to the effort is new. He’s eager to see what the algorithms do with the volume and variability of TAPS farm management decision data.
He hopes to build a prediction model with TAPS data and then test it in future competitions.
“I hope it can provide a dynamic, potential yield output to a participant, one that can change as competitors make their decisions and apply their inputs,” he said, and potentially offer a valuable real-world management tool to farmers.
Article by Christine Hamilton